Programmingempire
The following code shows an example to Find the Sum and Average of List Elements in Python. In order to perform it first create a list. After that take a variable sum. Initialize it to 0. Now start a for-loop. For the purpose of finding the count of elements in the list, we can use the range() function. Further, add all elements of the list in the loop. Once you get the sum, display it using the print() function. Finally, compute the average and display it. Also, you can round the average to two places of decimal.
mylist=[12, 11, 45, 90, 88, 70]
sum=0
print('list elements: ')
for i in range(len(mylist)):
print(mylist[i])
sum+=mylist[i]
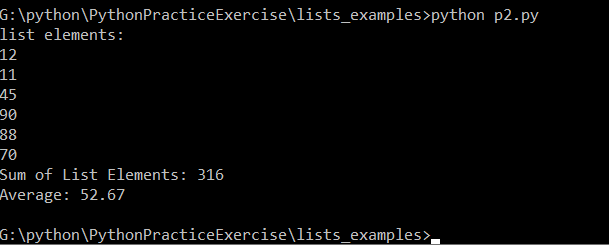
print('Sum of List Elements: '+str(sum))
avg=round(sum/len(mylist), 2)
print('Average: '+str(avg))Output
Further Reading
How to Implement Inheritance in Python
Find Prime Numbers in Given Range in Python
Running Instructions in an Interactive Interpreter in Python
Deep Learning Practice Exercise
Deep Learning Methods for Object Detection
Image Contrast Enhancement using Histogram Equalization
Transfer Learning and its Applications
Examples of OpenCV Library in Python
Understanding Blockchain Concepts
Example of Multi-layer Perceptron Classifier in Python
Measuring Performance of Classification using Confusion Matrix
Artificial Neural Network (ANN) Model using Scikit-Learn
Popular Machine Learning Algorithms for Prediction
Long Short Term Memory – An Artificial Recurrent Neural Network Architecture
Python Project Ideas for Undergraduate Students
Creating Basic Charts using Plotly
Visualizing Regression Models with lmplot() and residplot() in Seaborn
Data Visualization with Pandas
A Brief Introduction of Pandas Library in Python
A Brief Tutorial on NumPy in Python
- Angular
- ASP.NET
- C
- C#
- C++
- CSS
- Dot Net Framework
- HTML
- IoT
- Java
- JavaScript
- Kotlin
- PHP
- Power Bi
- Python
- Scratch 3.0
- TypeScript
- VB.NET
