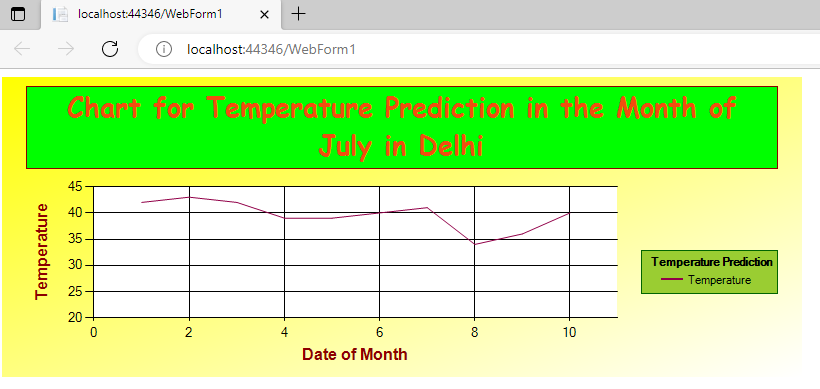
The following code example shows a Line Chart with Two Database Fields in ASP.NET.

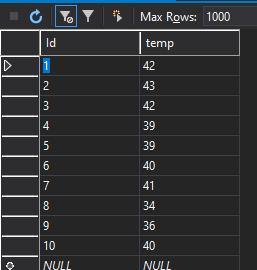
To begin with, we need some data that is to be displayed on the chart. Since, it is a two-dimensional chart, we must have two data fields. Therefore, we create a table called Temperatures. It has two fields – Id, and temp. While the field Id serves as the date of the month, the temp fields represents the temperature in degree celsius.
The following database table is used to create the chart.
WebForm1.aspx
The following code shows the chart control on the aspx page. Basically, the asp:Chart tag contains several other tags to represent the various components of the chart. So, the series tag represents the series data and specifies the chart type, type of data, index of data fields, and formatting attributes.
Similarly, we specify the chartarea, legend, and titles tag.
<%@ Page Language="C#" AutoEventWireup="true" CodeBehind="WebForm1.aspx.cs" Inherits="ChartControl.WebForm1" %>

<%@ Register Assembly="System.Web.DataVisualization, Version=4.0.0.0, Culture=neutral, PublicKeyToken=31bf3856ad364e35" Namespace="System.Web.UI.DataVisualization.Charting" TagPrefix="asp" %>

<!DOCTYPE html>

<html xmlns="http://www.w3.org/1999/xhtml">
<head runat="server">
    <title></title>
</head>
<body>
    <form id="form1" runat="server">
        <div>
           <asp:Chart runat="server" ID="Chart1" Width="800px" BackColor="Yellow"
                BackGradientStyle="DiagonalLeft">
                <series>
                    <asp:Series Name="Temperature" ChartType="Line" XValueMember="0" YValueMembers="1"
                         MarkerStep="1" XValueType="Int32" YValueType="Int32" Color="#910048"
                         >
                    </asp:Series>
                </series>
                <chartareas>
                    <asp:ChartArea Name="ChartArea1" BorderColor="Lime" BorderWidth="5">
                    </asp:ChartArea>
                </chartareas>
                <Legends>
                    <asp:Legend Name="Legend1" Alignment="Center" BackColor="YellowGreen"
                         BorderColor="DarkGreen" IsTextAutoFit="true"
                         Title="Temperature Prediction" TitleAlignment="Center">
                    </asp:Legend>
                </Legends>
                <Titles>
                    <asp:Title
                        Text="Chart for Temperature Prediction in the Month of July in Delhi"
                         Font="Arial Black" ForeColor="#f14d0e" BorderColor="DarkRed"
                         BackColor="Lime">
                    </asp:Title>
                </Titles>
            </asp:Chart>
        </div>
    </form>
</body>
</html>
WebForm1.aspx.cs
In order to access the data, we create a connection with the database. Further, we specify the DataSource property of the Chart control and call its DataBind() method. After that we can specify other properties of the Chart control.
using System;
using System.Collections.Generic;
using System.Linq;
using System.Web;
using System.Web.UI;
using System.Web.UI.WebControls;
using System.Data;
using System.Data.SqlClient;
namespace ChartControl
{
    public partial class WebForm1 : System.Web.UI.Page
    {
        SqlConnection c1;
        SqlDataAdapter da;
        DataSet ds;
        public void Connect()
        {
            c1 = new SqlConnection(@"your ");
            c1.Open();
        }

        public void BindChart()
        {
            Connect();
            String cmd_str = "select * from Temperatures";
            da = new SqlDataAdapter(cmd_str, c1);
            ds = new DataSet();
            da.Fill(ds, "TP");
            Chart1.DataSource = ds;
            Chart1.DataBind();
        }
        protected void Page_Load(object sender, EventArgs e)
        {
            BindChart();
            Chart1.ChartAreas[0].AxisX.Interval = 2;
            Chart1.ChartAreas[0].AxisY.Minimum = 20;

            Chart1.Titles[0].Font = new System.Drawing.Font("Comic Sans Ms", 20, System.Drawing.FontStyle.Bold);
            Chart1.ChartAreas[0].AxisX.Title = "Date of Month";
            Chart1.ChartAreas[0].AxisX.TitleFont = new System.Drawing.Font("Arial", 12, System.Drawing.FontStyle.Bold);
            Chart1.ChartAreas[0].AxisX.TitleForeColor = System.Drawing.Color.DarkRed;

            Chart1.ChartAreas[0].AxisY.Title = "Temperature";
            Chart1.ChartAreas[0].AxisY.TitleFont = new System.Drawing.Font("Arial", 12, System.Drawing.FontStyle.Bold);
            Chart1.ChartAreas[0].AxisY.TitleForeColor = System.Drawing.Color.DarkRed;
        }
    }
}
Output
Further Reading
Parameter and ParameterCollection in ADO.NET
Database Manipulation Using DataGrid
Example of Button and Link Button Control in ASP.NET
Example of Chart Control in ASP.NET
Creating a DataTable from a DataReader in ASP.NET
Deleting a Record using DataGrid Control in ASP.NET
Edit a Record Using DataGrid Control in ASP.NET
- AI
- Android
- Angular
- ASP.NET
- Augmented Reality
- AWS
- Bioinformatics
- Biometrics
- Blockchain
- Bootstrap
- C
- C#
- C++
- Cloud Computing
- Competitions
- Courses
- CSS
- Cyber Security
- Data Science
- Data Structures and Algorithms
- Data Visualization
- Datafication
- Deep Learning
- DevOps
- Digital Forensic
- Digital Trust
- Digital Twins
- Django
- Docker
- Dot Net Framework
- Drones
- Elasticsearch
- ES6
- Extended Reality
- Flutter and Dart
- Full Stack Development
- Git
- Go
- HTML
- Image Processing
- IoT
- IT
- Java
- JavaScript
- Kotlin
- Latex
- Machine Learning
- MEAN Stack
- MERN Stack
- Microservices
- MongoDB
- NodeJS
- PHP
- Power Bi
- Projects
- Python
- Quantum Computing
- React
- Robotics
- Rust
- Scratch 3.0
- Shell Script
- Smart City
- Software
- Solidity
- SQL
- SQLite
- Tecgnology
- Tkinter
- TypeScript
- VB.NET
- Virtual Reality
- Web Designing
- WebAssembly
- XML