Programmingempire
This article shows an example of Chart Control in ASP.NET. Basically, the Chart Web Control makes use of the Chart class. In fact, you can create almost any type of chart using this control.
The Chart Class
As I have said earlier, the Chart class is available in System.Web.DataVisualization namespace provides the functionality for the Chart control. Evidently, it has several collections as its properties that help us visualize the data in a graphical form.
Properties of the Chart Control
The following list provides the important properties of the Chart Web Control.
- At first, we need to define the Series. Basically, the Series is an object for storing data points of the chart. In addition, it stores other attributes. For instance, it also stores appearance-related properties such as BackColor. Similarly, it contains properties for formatting Series Label. Particularly, it stores data points. Also, you can perform calculations on the series data. In fact, the Series property of Chart control determines the type of chart using the ChartType property. Hence, it allows you to draw a bar chart, a pie chart, a line chart, and so on.
- Another important property is ChartAreas. In order to draw the data points on the x and y-axis, a ChartArea object represents the rectangular area. Besides the plotting of data points, the area also contains labels for the x and y-axis. In fact, you can plot any number of chart series within the same area. Moreover, you can display multiple chart areas using a Chart Control.
- Together with Series, and ChartAreas, a Chart control also has a Titles collection. Accordingly, each Title object within the collection specifies a title for the chart. In fact, there are several features to customize a title. For instance, the title can be aligned, docked, and positioned inside or outside the plot. Further, it can display a background image or a gradient. Also, you can apply styles to the title text.
- Furthermore, a Chart control can also have a Map Area collection. While the collection contains one or more MapArea objects that display an image map. Therefore, it also has a PostBackValue property that represents a postback value.
Legends and Annotations in the Chart Control
Basically, Legends describes a LegendCollection and contains one or more Legend objects. Like the Title object, the Legend object also has properties for customizing its appearance and position. Additionally, we can change the legend symbol to rectangle, dots, or line.
In order to make your chart self-explainatory, you can also add annotations to it. In fact, the Annotations property in the Chart control represents an AnnotationCollection that contains annotations for the chart.
Example of Chart Control
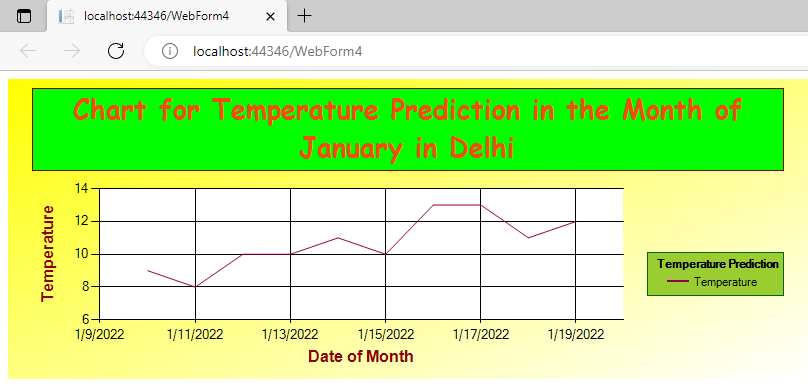
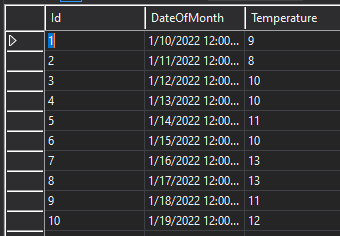
The following code shows an example of plotting a line chart using the Chart control. Since, it is a data-bound control, we can use data from a database table. Therefore, in this example, we are using a database table named TemperaturePrediction. As shown below, the table contains three fields – id, datevalue, and avg_temperature.
Since we want to plot the average temparure for different days of monthe, the datevalue field is used for x-axis values. While, the avg_temperature represents the y-values. As can be seen, the Chart control contains Series, ChartAreas, Titles, and Legends collections.
WebForm1.aspx
<%@ Page Language="C#" AutoEventWireup="true" CodeBehind="WebForm1.aspx.cs" Inherits="ChartControlExample.WebForm1" %>

<%@ Register Assembly="System.Web.DataVisualization, Version=4.0.0.0, Culture=neutral, PublicKeyToken=31bf3856ad364e35" Namespace="System.Web.UI.DataVisualization.Charting" TagPrefix="asp" %>

<!DOCTYPE html>
<html xmlns="http://www.w3.org/1999/xhtml">
<head runat="server">
    <title></title>
</head>
<body>
    <form id="form1" runat="server">
        <div>
            <asp:Chart runat="server" ID="Chart1" Width="800px" BackColor="Yellow"
                BackGradientStyle="DiagonalLeft">
                <series>
                    <asp:Series Name="Temperature" ChartType="Line" XValueMember="1" YValueMembers="2"
                         MarkerStep="1" XValueType="DateTime" YValueType="Int32" Color="#910048"
                         >
                    </asp:Series>
                </series>
                <chartareas>
                    <asp:ChartArea Name="ChartArea1" BorderColor="Lime" BorderWidth="5">
                    </asp:ChartArea>
                </chartareas>
                <Legends>
                    <asp:Legend Name="Legend1" Alignment="Center" BackColor="YellowGreen"
                         BorderColor="DarkGreen" IsTextAutoFit="true"
                         Title="Temperature Prediction" TitleAlignment="Center">
                    </asp:Legend>
                </Legends>
                <Titles>
                    <asp:Title
                        Text="Chart for Temperature Prediction in the Month of July in Delhi"
                         Font="Arial Black" ForeColor="#f14d0e" BorderColor="DarkRed"
                         BackColor="Lime">
                    </asp:Title>
                </Titles>
            </asp:Chart>
        </div>
    </form>
</body>
</html>
In order to fetch, the values from database table, we use the disconnected approach. Acordingly, we create a DataSet object that contains the data. Therefore, we set the DataSource property of Chart control to the DataSet object. After that, we call the DataBind() method. As can be seen in the code, we set some of the properties dynamically. For example, we can set the Interval for x-values. Also, we can set the minimum starting value for y-axis. Likewise, we can also set the titles for x and y-axis.
WebForm1.aspx.cs
using System;
using System.Data;
using System.Data.SqlClient;
using System.Web.UI.DataVisualization.Charting;

namespace ChartControlExample
{
    public partial class WebForm1 : System.Web.UI.Page
    {
        SqlConnection c1;
        SqlDataAdapter da;
        DataSet ds;
        public void Connect()
        {
            c1 = new SqlConnection(@"your connection string");
            c1.Open();
        }
        public void BindChart()
        {
            Connect();
            String cmd_str = "select * from TemperaturePrediction";
            da = new SqlDataAdapter(cmd_str, c1);
            ds = new DataSet();
            da.Fill(ds, "TP");
            Chart1.DataSource = ds;
            Chart1.DataBind();
        }
        protected void Page_Load(object sender, EventArgs e)
        {
            BindChart();
            Chart1.ChartAreas[0].AxisX.Interval = 2;
            Chart1.ChartAreas[0].AxisY.Minimum = 20;

            Chart1.Titles[0].Font = new System.Drawing.Font("Comic Sans Ms", 20, System.Drawing.FontStyle.Bold);
            Chart1.ChartAreas[0].AxisX.Title = "Date of Month";
            Chart1.ChartAreas[0].AxisX.TitleFont = new System.Drawing.Font("Arial", 12, System.Drawing.FontStyle.Bold);
            Chart1.ChartAreas[0].AxisX.TitleForeColor = System.Drawing.Color.DarkRed;

            Chart1.ChartAreas[0].AxisY.Title = "Temperature";
            Chart1.ChartAreas[0].AxisY.TitleFont = new System.Drawing.Font("Arial", 12, System.Drawing.FontStyle.Bold);
            Chart1.ChartAreas[0].AxisY.TitleForeColor = System.Drawing.Color.DarkRed;

        }

    }
}
Output
Database Table
Another example of the Chart Control using two database fields is available here. Likewise we can create a Column chart as described here. Similarly, we can create a pie chart also. It is shown here. Another example of Chart control that displays a Column chart is given here.
Further Reading
Parameter and ParameterCollection in ADO.NET
Database Manipulation Using DataGrid
Example of Button and Link Button Control in ASP.NET
Example of Chart Control in ASP.NET
Creating a DataTable from a DataReader in ASP.NET
Deleting a Record using DataGrid Control in ASP.NET
Edit a Record Using DataGrid Control in ASP.NET
Insert a Record Using ItemCommand Event in DataGrid
CRUD Operations with DataGrid in ASP.NET
Creating Columns in a DataGrid Control
XML Documents and DataSet in ASP.NET
ASP.NET Core Features and Advantages
Display Images Using DataList Control
Adding Images Using Image Control
Creating a Group of Radio Buttons Using RadioButtonList Control
Example of Button Control in ASP.NET
ItemDataBound Event in DataList
More Features of DataList in ASP.NET
A Simple Example of Using a DataList Control in ASP.NET
Properties and Methods of DataList Control in ASP.NET
Exploring DataList Control in ASP.NET
Custom Validator Control in ASP.NET
Validation Summary Control in ASP.NET
Validation Controls Examples – RequiredFieldValidator, CompareValidator, and RangeValidator
An Example of Data Binding with RadioButtonList Control
Binding Data to Web Control in ADO.NET
Examples of AdRotator Control in ASP.NET
Examples of Validation Controls in ASP.NET
Overview of MVC architecture in ASP.NET
- Angular
- ASP.NET
- C
- C#
- C++
- CSS
- Dot Net Framework
- HTML
- IoT
- Java
- JavaScript
- Kotlin
- PHP
- Power Bi
- Python
- Scratch 3.0
- TypeScript
- VB.NET
