The following code example demonstrates How to Create a Column Chart in ASP.NET.

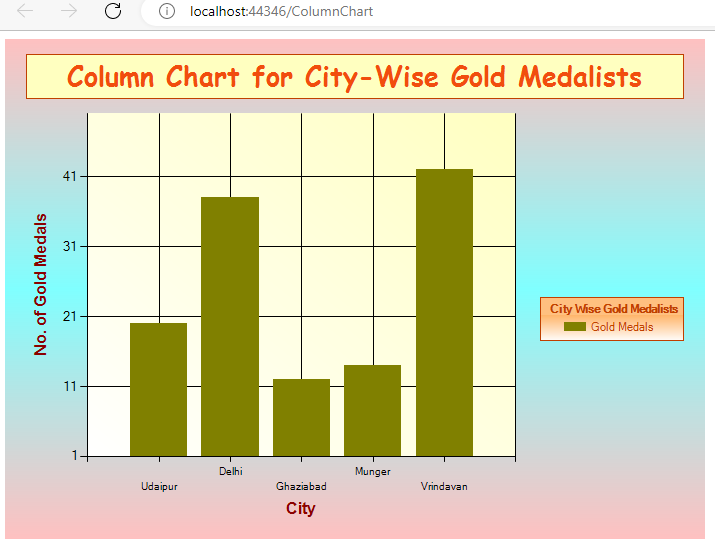
Basically, a column chart is a vertical bar chart. We use a column chart to display categories in rectangular manner. Furthermore, a column chart makes it easy for category-wise comparison. For instance, suppose we have data of gold medalists in a number of cities and we want to do a comparison. So, we can use a column chart in such situation. The following example demonstrates how to create a column chart for the data stored in a database table.
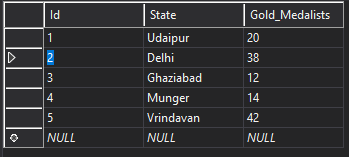
Database Table
The following database table is used in this example.
ColumnChart.aspx
The following code shows the chart control in ASP.NET. Also note the use of various components of the chart control. For example, we use Series here to represent the data. Similarly, we can use Chart Areas to specify the styles on the complete chart area. Likewise, we can use Legend and Titles.
<%@ Page Language="C#" AutoEventWireup="true" CodeBehind="ColumnChart.aspx.cs" Inherits="ChartControl.ColumnChart" %>

<!DOCTYPE html>

<html xmlns="http://www.w3.org/1999/xhtml">
<head runat="server">
    <title></title>
</head>
<body>
    <form id="form1" runat="server">
        <div>
            <asp:Chart ID="Chart1" runat="server" height="500" Width="700" BackColor="255, 192, 192" BackGradientStyle="HorizontalCenter" BackSecondaryColor="128, 255, 255" BorderlineColor="64, 0, 64" BorderlineWidth="5" Palette="Light">
                <series>
                    <asp:Series Name="Gold Medals" ChartType="Column"  XValueMember="1" YValueMembers="2"
                         MarkerStep="1" XValueType="String" YValueType="Int32" Color="Olive" LabelForeColor="DarkRed" >
                    </asp:Series>
                </series>
                <chartareas>
                    <asp:ChartArea Name="ChartArea1" BorderColor="0, 64, 0" BorderWidth="5" BackColor="255, 255, 192" BackGradientStyle="DiagonalRight" ShadowColor="192, 255, 192">
                    </asp:ChartArea>
                </chartareas>
                <Legends>
                    <asp:Legend Name="Legend1" Alignment="Center" BackColor="255, 128, 0"
                         BorderColor="192, 64, 0" IsTextAutoFit="true"
                         Title="City Wise Gold Medalists" TitleAlignment="Center" BackGradientStyle="TopBottom" ForeColor="192, 64, 0" TitleBackColor="255, 192, 128" TitleForeColor="192, 64, 0">
                    </asp:Legend>
                </Legends>
                <Titles>
                    <asp:Title
                        Text="Column Chart for City-Wise Gold Medalists"
                         Font="Arial Black" ForeColor="#f14d0e" BorderColor="192, 64, 0"
                         BackColor="255, 255, 192">
                    </asp:Title>
                </Titles>
            </asp:Chart>
        </div>
    </form>
</body>
</html>
ColumnChart.aspx.cs
In order to fetch data from the database table, we use the disconnected approach for database access. So, we use SqlDataAdapter, and DataSet objects that represent the in-memory database. Once, we get the data in a DataSet object, we can set the DataSource property of the Chart control. Finally, we call the DataBind() method of the Chart control that displays the data in the chart.
using System;
using System.Collections.Generic;
using System.Linq;
using System.Web;
using System.Web.UI;
using System.Web.UI.WebControls;
using System.Data;
using System.Data.SqlClient;
namespace ChartControl
{
    public partial class ColumnChart : System.Web.UI.Page
    {
        SqlConnection c1;
        SqlDataAdapter da;
        DataSet ds;
        public void Connect()
        {
            c1 = new SqlConnection(@"Data Source=(LocalDB)\MSSQLLocalDB;AttachDbFilename=C:\Users\Administrator.KAVITA-PC\Documents\d1.mdf;Integrated Security=True;Connect Timeout=30");
            c1.Open();
        }

        public void BindChart()
        {
            Connect();
            String cmd_str = "select * from GoldMedalists";
            da = new SqlDataAdapter(cmd_str, c1);
            ds = new DataSet();
            da.Fill(ds, "TP");
            Chart1.DataSource = ds;
            Chart1.DataBind();
        }
        protected void Page_Load(object sender, EventArgs e)
        {
            BindChart();
            Chart1.ChartAreas[0].AxisX.Interval = 1;
            Chart1.ChartAreas[0].AxisY.Minimum = 1;

            Chart1.Titles[0].Font = new System.Drawing.Font("Comic Sans Ms", 20, System.Drawing.FontStyle.Bold);
            Chart1.ChartAreas[0].AxisX.Title = "City";
            Chart1.ChartAreas[0].AxisX.TitleFont = new System.Drawing.Font("Arial", 12, System.Drawing.FontStyle.Bold);
            Chart1.ChartAreas[0].AxisX.TitleForeColor = System.Drawing.Color.DarkRed;

            Chart1.ChartAreas[0].AxisY.Title = "No. of Gold Medals";
            Chart1.ChartAreas[0].AxisY.TitleFont = new System.Drawing.Font("Arial", 12, System.Drawing.FontStyle.Bold);
            Chart1.ChartAreas[0].AxisY.TitleForeColor = System.Drawing.Color.DarkRed;
        }
    }
}
Output
Further Reading
Parameter and ParameterCollection in ADO.NET
Database Manipulation Using DataGrid
Example of Button and Link Button Control in ASP.NET
Example of Chart Control in ASP.NET
Creating a DataTable from a DataReader in ASP.NET
- AI
- Android
- Angular
- ASP.NET
- Augmented Reality
- AWS
- Bioinformatics
- Biometrics
- Blockchain
- Bootstrap
- C
- C#
- C++
- Cloud Computing
- Competitions
- Courses
- CSS
- Cyber Security
- Data Science
- Data Structures and Algorithms
- Data Visualization
- Datafication
- Deep Learning
- DevOps
- Digital Forensic
- Digital Trust
- Digital Twins
- Django
- Docker
- Dot Net Framework
- Drones
- Elasticsearch
- ES6
- Extended Reality
- Flutter and Dart
- Full Stack Development
- Git
- Go
- HTML
- Image Processing
- IoT
- IT
- Java
- JavaScript
- Kotlin
- Latex
- Machine Learning
- MEAN Stack
- MERN Stack
- Microservices
- MongoDB
- NodeJS
- PHP
- Power Bi
- Projects
- Python
- Quantum Computing
- React
- Robotics
- Rust
- Scratch 3.0
- Shell Script
- Smart City
- Software
- Solidity
- SQL
- SQLite
- Tecgnology
- Tkinter
- TypeScript
- VB.NET
- Virtual Reality
- Web Designing
- WebAssembly
- XML