The following article describes How to Implement Linear Regression With Multiple variables.

Problem Statement
Use the sklearn library to create a linear regression with multiple variables. Load a well known dataset split it into training and testing sets, and then train the model to predict a target variable based on one or more features. For instance, you can use the following dataset.
https://raw.githubusercontent.com/sachinmotwani20/NPTEL-ML_Datasets/main/ScoresPrediction.
Solution
In order to create a linear regression model with multiple variables using the scikit-learn (sklearn) library, you can follow these steps.
- Import the necessary libraries.
- Load the dataset from the provided URL.
- Split the dataset into training and testing sets.
- Create and train the linear regression model.
- Evaluate the model’s performance.
The following Python code example does this.
# Import necessary libraries
import pandas as pd
import numpy as np
from sklearn.model_selection import train_test_split
from sklearn.linear_model import LinearRegression
from sklearn.metrics import mean_squared_error, r2_score
from urllib.request import urlopen
import matplotlib.pyplot as plt

# Load the dataset from the provided URL
url = "https://raw.githubusercontent.com/sachinmotwani20/NPTEL-ML_Datasets/main/ScoresPrediction.csv"
data = pd.read_csv(urlopen(url))

# Check the first few rows of the dataset
print(data.head())

# Separate the features (X) and target variable (y)
X = data.drop('FinalYrScore', axis=1)  # Assuming 'FinalYrScore' is the target variable
y = data['FinalYrScore']

# Split the dataset into training and testing sets (e.g., 80% training, 20% testing)
X_train, X_test, y_train, y_test = train_test_split(X, y, test_size=0.2, random_state=42)

# Create and train the linear regression model
model = LinearRegression()
model.fit(X_train, y_train)

# Make predictions on the test set
y_pred = model.predict(X_test)

# Evaluate the model's performance
mse = mean_squared_error(y_test, y_pred)
r2 = r2_score(y_test, y_pred)

print(f"Mean Squared Error (MSE): {mse}")
print(f"R-squared (R2) Score: {r2}")

# Plotting the linear regression line
plt.figure(figsize=(10, 6))
plt.scatter(X_test['FirstYrScore'], y_test, color='blue', label='Actual Scores')
plt.plot(X_test['FirstYrScore'], y_pred, color='red', linewidth=2, label='Linear Regression Line')
plt.xlabel('First Year Score')
plt.ylabel('Final Year Score')
plt.title('Linear Regression for Score Prediction')
plt.legend()
plt.grid(True)
plt.show()
Output
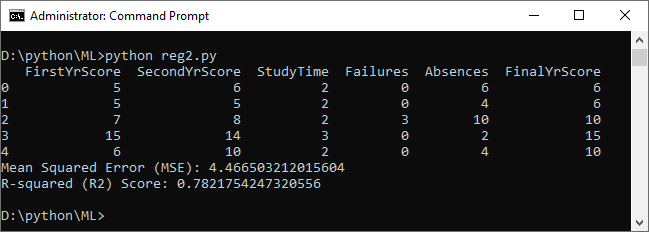
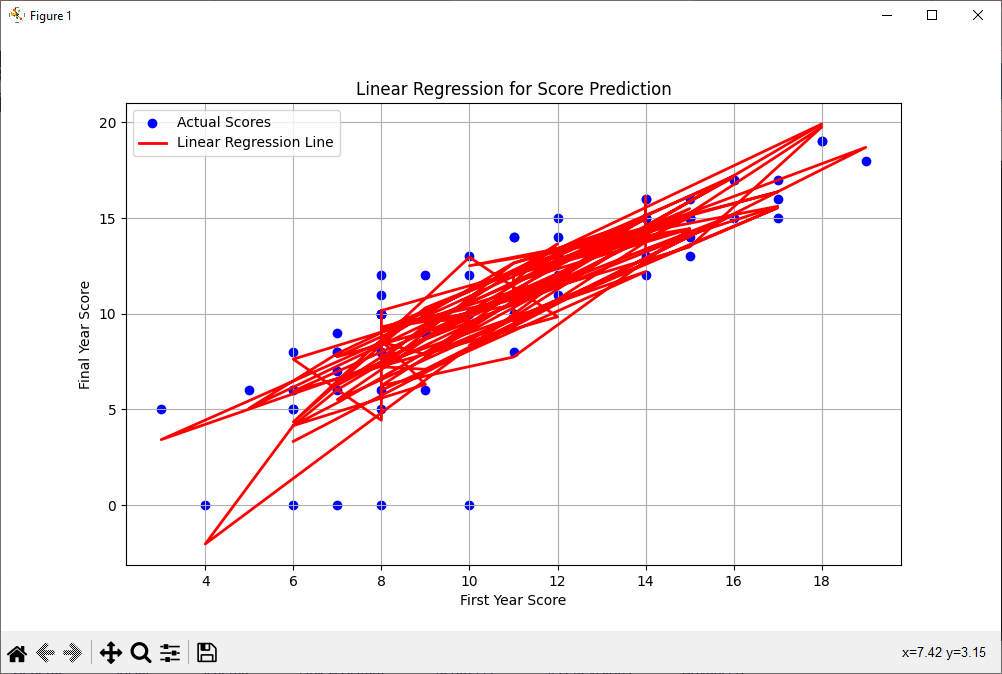
This code will load the dataset, split it into training and testing sets, train a linear regression model, evaluate its performance, and then plot the linear regression line along with the actual data points.
Further Reading
50+ interview questions along with their answers on Python
How to Perform Dataset Preprocessing in Python?
Spring Framework Practice Problems and Their Solutions
How to Implement Linear Regression from Scratch?
Getting Started with Data Analysis in Python
Wake Up to Better Performance with Hibernate
Data Science in Insurance: Better Decisions, Better Outcomes
Breaking the Mold: Innovative Ways for College Students to Improve Software Development Skills
- Angular
- ASP.NET
- C
- C#
- C++
- CSS
- Dot Net Framework
- HTML
- IoT
- Java
- JavaScript
- Kotlin
- PHP
- Power Bi
- Python
- Scratch 3.0
- TypeScript
- VB.NET