In this article, I will describe How to Create a Pie Chart in ASP.NET.

Basically, a pie chart depicts the proportion of a specific part to the whole. In fact, we use the pie chart to visualize the percentage of different parts. For instance, suppose we have the data of sales of laptops belonging to the different brands. Further, we may be interested in knowing how much percentage of each type of laptop is sold. For this purpose, we can use a pie chart. A pie chart shows a circle with different parts. In this example, we will use the table ProductSales that contains a field called Laptop Brand that contains the name of a brand. Another field called sales contains the percentage of sales.
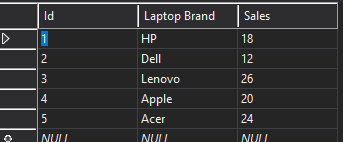
Database Table
The following figure shows the database table.
Further, we create the above table as follows.
CREATE TABLE [dbo].[ProductSales] (
    [Id]           INT        NOT NULL,
    [Laptop Brand] NCHAR (10) NULL,
    [Sales]        INT        NULL,
    PRIMARY KEY CLUSTERED ([Id] ASC)
);
WebForm3.aspx
The following code shows the design part. Note the properties ChartType that contains the value of a chart type like a Line Chart, Bar Chart, Pie Chart, and so on. Also, we need to specify the index of columns of the database table (starting from 0). Apart from these properties, we need to specify the data types of each field.
<%@ Page Language="C#" AutoEventWireup="true" CodeBehind="WebForm3.aspx.cs" Inherits="ChartControl.WebForm3" %>

<!DOCTYPE html>

<html xmlns="http://www.w3.org/1999/xhtml">
<head runat="server">
    <title></title>
</head>
<body>
    <form id="form1" runat="server">
        <div>
              <asp:Chart runat="server" ID="Chart1" Width="800px" BackColor="Yellow"
                BackGradientStyle="DiagonalLeft">
                <series>
                    <asp:Series Name="Sales" ChartType="Pie"  XValueMember="1" YValueMembers="2"
                         MarkerStep="1" XValueType="String" YValueType="Int32" Color="#910048"
                         >
                    </asp:Series>
                </series>
                <chartareas>
                    <asp:ChartArea Name="ChartArea1" BorderColor="Lime" BorderWidth="5">
                    </asp:ChartArea>
                </chartareas>
                <Legends>
                    <asp:Legend Name="Legend1" Alignment="Center" BackColor="YellowGreen"
                         BorderColor="DarkGreen" IsTextAutoFit="true"
                         Title="Sales of Products" TitleAlignment="Center">
                    </asp:Legend>
                </Legends>
                <Titles>
                    <asp:Title
                        Text="Pie Chart for Sales of Laptop"
                         BackColor="Lime">
                    </asp:Title>
                </Titles>
            </asp:Chart>
        </div>
    </form>
</body>
</html>
WebForm3.aspx.cs
using System;
using System.Collections.Generic;
using System.Linq;
using System.Web;
using System.Web.UI;
using System.Web.UI.WebControls;
using System.Data;
using System.Data.SqlClient;
namespace ChartControl
{
public partial class WebForm3 : System.Web.UI.Page
{
SqlConnection c1;
SqlDataAdapter da;
DataSet ds;
public void Connect()
{
c1 = new SqlConnection(@"Data Source=(LocalDB)\MSSQLLocalDB;AttachDbFilename=C:\Users\Administrator.KAVITA-PC\Documents\d1.mdf;Integrated Security=True;Connect Timeout=30");
c1.Open();
}
public void BindChart()
{
Connect();
String cmd_str = "select * from ProductSales";
da = new SqlDataAdapter(cmd_str, c1);
ds = new DataSet();
da.Fill(ds, "TP");
Chart1.DataSource = ds;
Chart1.DataBind();
}
protected void Page_Load(object sender, EventArgs e)
{
BindChart();
//Chart1.ChartAreas[0].AxisX.Interval = 2;
// Chart1.ChartAreas[0].AxisY.Minimum = 20;
Chart1.Titles[0].Font = new System.Drawing.Font("Comic Sans Ms", 20, System.Drawing.FontStyle.Bold);
Chart1.ChartAreas[0].AxisX.Title = "Date of Month";
Chart1.ChartAreas[0].AxisX.TitleFont = new System.Drawing.Font("Arial", 12, System.Drawing.FontStyle.Bold);
Chart1.ChartAreas[0].AxisX.TitleForeColor = System.Drawing.Color.DarkRed;
Chart1.ChartAreas[0].AxisY.Title = "Laptop Brand";
Chart1.ChartAreas[0].AxisY.TitleFont = new System.Drawing.Font("Arial", 12, System.Drawing.FontStyle.Bold);
Chart1.ChartAreas[0].AxisY.TitleForeColor = System.Drawing.Color.DarkRed;
//Chart1.Series[0].Label = "#PERCENT{P0}";
}
}
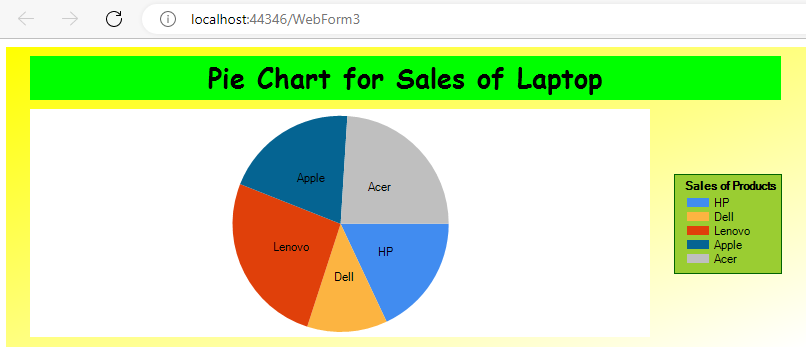
}Output
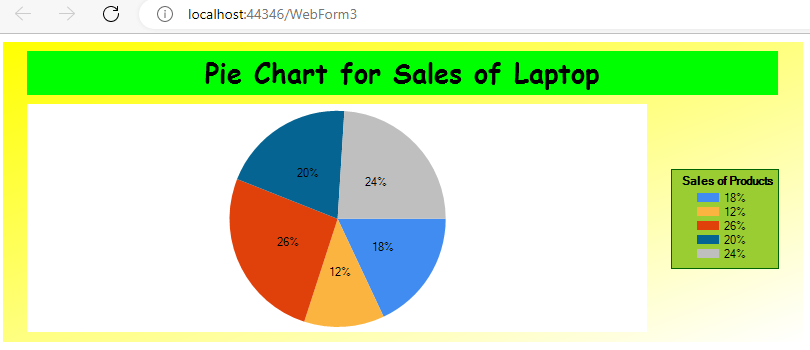
Instead of showing product labels, we can also display the percentage of sales. For this purpose, we need to change the Label property of Series as follows.
Chart1.Series[0].Label = "#PERCENT{P0}";Therefore, we need to change the page_load() function as follows.
protected void Page_Load(object sender, EventArgs e)
        {
            BindChart();
            //Chart1.ChartAreas[0].AxisX.Interval = 2;
           // Chart1.ChartAreas[0].AxisY.Minimum = 20;

            Chart1.Titles[0].Font = new System.Drawing.Font("Comic Sans Ms", 20, System.Drawing.FontStyle.Bold);
            Chart1.ChartAreas[0].AxisX.Title = "Date of Month";
            Chart1.ChartAreas[0].AxisX.TitleFont = new System.Drawing.Font("Arial", 12, System.Drawing.FontStyle.Bold);
            Chart1.ChartAreas[0].AxisX.TitleForeColor = System.Drawing.Color.DarkRed;

            Chart1.ChartAreas[0].AxisY.Title = "Laptop Brand";
            Chart1.ChartAreas[0].AxisY.TitleFont = new System.Drawing.Font("Arial", 12, System.Drawing.FontStyle.Bold);
            Chart1.ChartAreas[0].AxisY.TitleForeColor = System.Drawing.Color.DarkRed;

            Chart1.Series[0].Label = "#PERCENT{P0}";

        }
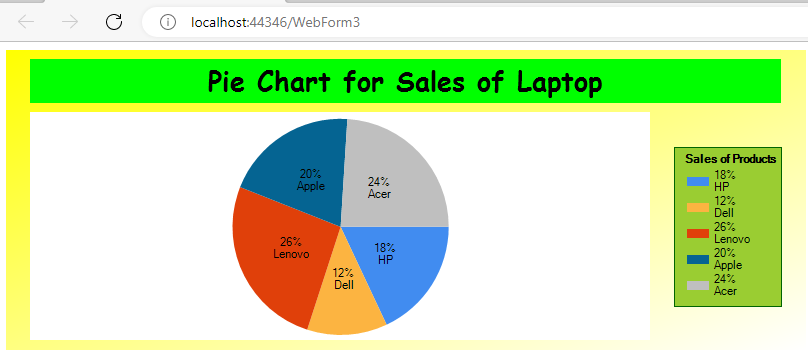
Also, it is possible to show both labels and percentage by changing the Label property of Series as follows.
Chart1.Series[0].Label = "#PERCENT{P0}\n#VALX";So, our page_load() function is also changed as follows. Rest of the code remains same.
protected void Page_Load(object sender, EventArgs e)
        {
            BindChart();
            //Chart1.ChartAreas[0].AxisX.Interval = 2;
           // Chart1.ChartAreas[0].AxisY.Minimum = 20;

            Chart1.Titles[0].Font = new System.Drawing.Font("Comic Sans Ms", 20, System.Drawing.FontStyle.Bold);
            Chart1.ChartAreas[0].AxisX.Title = "Date of Month";
            Chart1.ChartAreas[0].AxisX.TitleFont = new System.Drawing.Font("Arial", 12, System.Drawing.FontStyle.Bold);
            Chart1.ChartAreas[0].AxisX.TitleForeColor = System.Drawing.Color.DarkRed;

            Chart1.ChartAreas[0].AxisY.Title = "Laptop Brand";
            Chart1.ChartAreas[0].AxisY.TitleFont = new System.Drawing.Font("Arial", 12, System.Drawing.FontStyle.Bold);
            Chart1.ChartAreas[0].AxisY.TitleForeColor = System.Drawing.Color.DarkRed;

            //Chart1.Series[0].Label = "#PERCENT{P0}";
            Chart1.Series[0].Label = "#PERCENT{P0}\n#VALX";

        }
Output
Further Reading
Parameter and ParameterCollection in ADO.NET
Database Manipulation Using DataGrid
Example of Button and Link Button Control in ASP.NET
Example of Chart Control in ASP.NET
Creating a DataTable from a DataReader in ASP.NET
Deleting a Record using DataGrid Control in ASP.NET
Edit a Record Using DataGrid Control in ASP.NET
- AI
- Android
- Angular
- ASP.NET
- Augmented Reality
- AWS
- Bioinformatics
- Biometrics
- Blockchain
- Bootstrap
- C
- C#
- C++
- Cloud Computing
- Competitions
- Courses
- CSS
- Cyber Security
- Data Science
- Data Structures and Algorithms
- Data Visualization
- Datafication
- Deep Learning
- DevOps
- Digital Forensic
- Digital Trust
- Digital Twins
- Django
- Docker
- Dot Net Framework
- Drones
- Elasticsearch
- Extended Reality
- Git
- Go
- HTML
- Image Processing
- IoT
- IT
- Java
- JavaScript
- Kotlin
- Latex
- Machine Learning
- MEAN Stack
- MERN Stack
- Microservices
- MongoDB
- NodeJS
- PHP
- Power Bi
- Projects
- Python
- Quantum Computing
- React
- Robotics
- Rust
- Scratch 3.0
- Shell Script
- Smart City
- Software
- Solidity
- SQL
- SQLite
- Tecgnology
- TypeScript
- VB.NET
- Virtual Reality
- Web Designing
- WebAssembly
- XML